Harness Your OpenHands Agent with AI Observability and Governance

OpenHands is a leading open-source AI agent framework with top SWE-bench performance. AI coding agents are super powerful, but opaque. You hand them a task, they edit files, run terminal commands, browse the web, yet there is no structured record of what happened or whether the result was any good. In this post we show how MLflow gives you full observability and governance over OpenHands agents with tracing every step and evaluating every output with minimal setup.
What is OpenHands?
OpenHands is an open-source platform for building AI agents that interact with code, terminals, file systems, and the web. It ships as both a Python SDK and a CLI, making it easy to script autonomous workflows that go far beyond chat-based code assistants.
Key capabilities include:
- Terminal access - agents run shell commands in a sandboxed environment
- File editing - agents read, create, and modify project files
- Web browsing - agents navigate and extract information from the web
- MCP integration - agents connect to external tools via the Model Context Protocol
- Model-agnostic - works with Claude, OpenAI, and open-source models
Because OpenHands agents run autonomously, no human is watching every step in real time. That makes observability and governance critical. You need to know what happened, what tools fired, how many tokens were spent, and whether the output actually meets your bar. This is where MLflow comes in.
Trace OpenHands Agents via OpenTelemetry
When an agent runs autonomously, having visibility over what it did is important. Which tools fired? How many LLM calls were made? Where did the tokens go? Without this information, debugging failures and optimizing performance is guesswork.
MLflow Tracing is a powerful tool for adding observability to any agents with minimal setup. OpenHands emits OpenTelemetry traces natively, and MLflow accepts them out of the box. To connect OpenHands and MLflow, first start your MLflow server if you haven't already.
uvx mlflow server
To use other tools like pip, docker compose, etc, see the Set Up MLflow Server.
Then set the following three environment variables in your OpenHands script to connect the two:
import os

# Point OpenTelemetry traces to your MLflow server
os.environ["OTEL_EXPORTER_OTLP_ENDPOINT"] = "http://localhost:5000"
os.environ["OTEL_EXPORTER_OTLP_HEADERS"] = "x-mlflow-experiment-id=123" # Replace "123" with your MLflow experiment ID
os.environ["OTEL_EXPORTER_OTLP_TRACES_PROTOCOL"] = "http/protobuf"
With these set, here is a script that creates an OpenHands agent, gives it a simple task, and sends every trace to MLflow:
from openhands.sdk import LLM, Agent, Conversation, Tool
from openhands.tools.file_editor import FileEditorTool
from openhands.tools.task_tracker import TaskTrackerTool
from openhands.tools.terminal import TerminalTool

llm = LLM("openai/gpt-5")


agent = Agent(
    llm=llm,
    tools=[
        Tool(name=TerminalTool.name),
        Tool(name=FileEditorTool.name),
        Tool(name=TaskTrackerTool.name),
    ],
)

cwd = os.getcwd()
conversation = Conversation(agent=agent, workspace=cwd)

conversation.send_message("Write 3 facts about the current project into FACTS.txt.")
conversation.run()
print("All done!")
Once the agent finishes, every LLM call, tool invocation, and agent step appears as structured spans in MLflow. Navigate to the MLflow UI (e.g. http://localhost:5000), select the experiment set in the environment variables, and open on the "Traces" tab to view the recorded traces.
Clicking on the ID of the trace will open a new pane with more details as shown below.
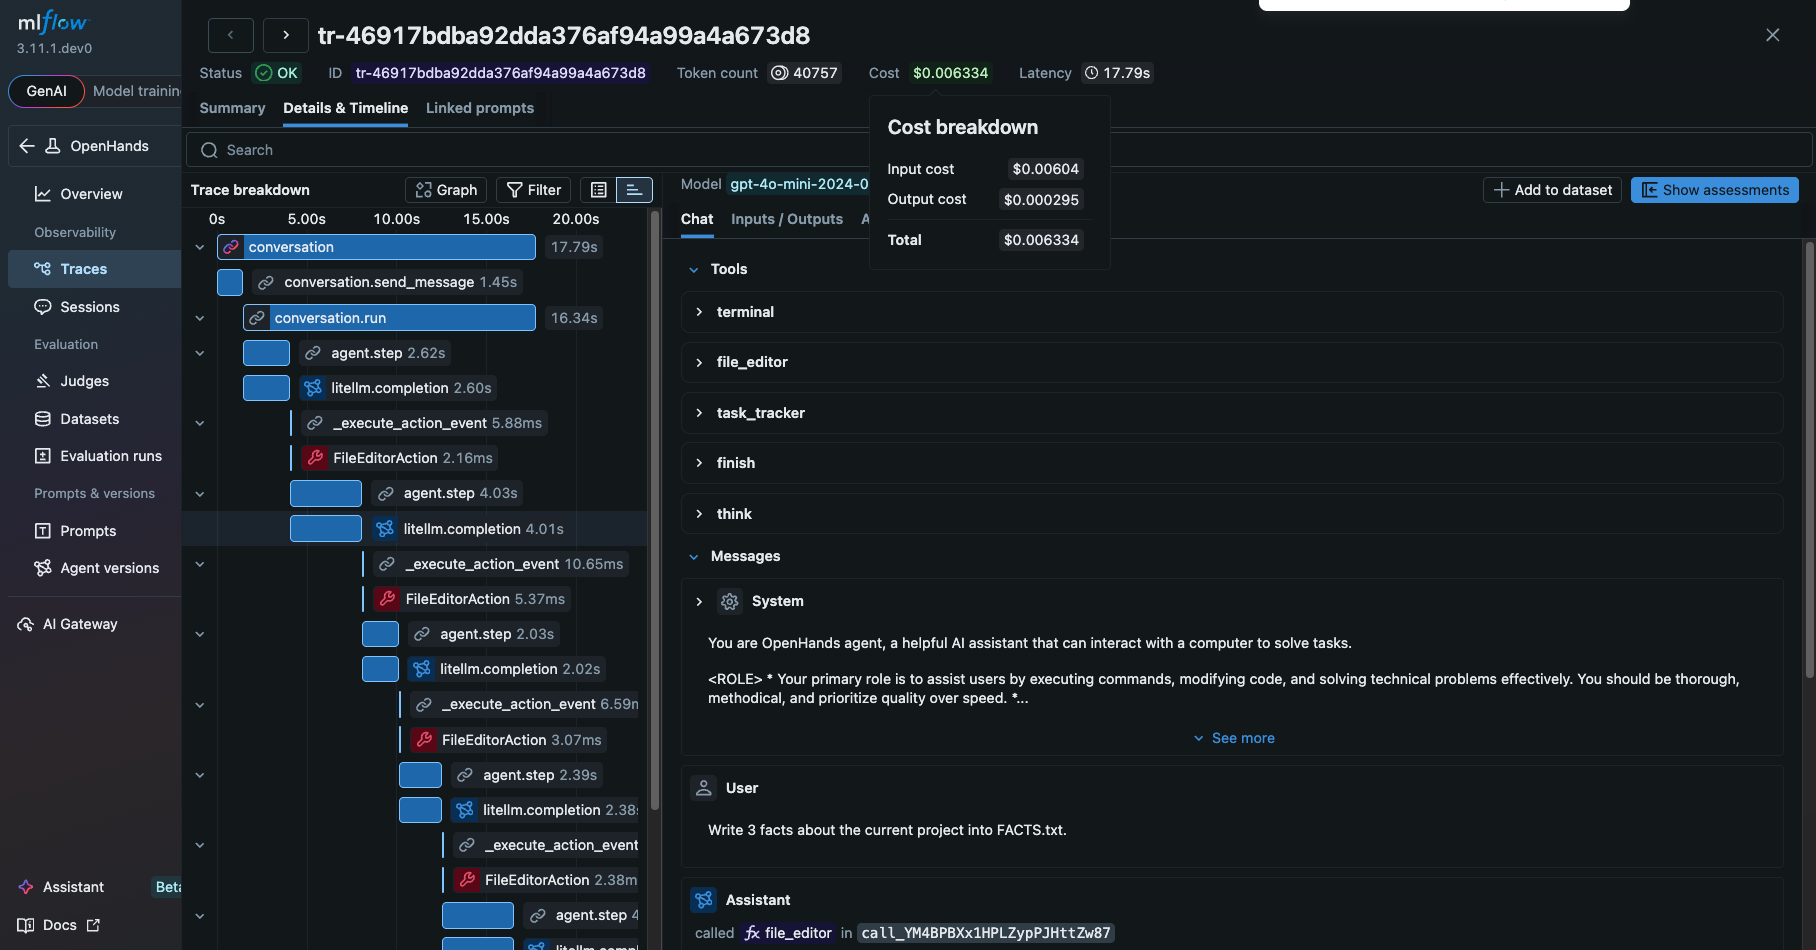
From this view, you can see a detailed information about the OpenHands agent, such as
- The prompt and response from the LLM
- Tools and the system prompt given to the agent
- The tools actually invoked by the agent and their inputs and outputs
- The latency of the each step
- The tokens usage breakdown and corresponding costs
These are extremely helpful for debugging and optimizing the OpenHands agent.
Evaluate OpenHands Agent Runs
Tracing tells you what happened. Evaluation tells you whether it was good. These are two complementary angles: observability and quality assurance. Did the agent produce the right result? Is the generated code correct? Is the output relevant to the original request? Was there any inefficient tool calls?
MLflow Evaluation is a comprehensive toolkit for agent developers to assess the quality of their agent in a systematic way. It provides 60+ built-in scorers and LLM judges, integration with popular libraries like RAGAS, DeepEval.
The quickest way to evaluate OpenHands agent runs is to directly run the built-in LLM judges from the MLflow UI.
- Select traces you want to evaluate from the "Traces" tab.
- Click "Run Judges" button in the actions menu.
- Select the judges you want to run and submit.
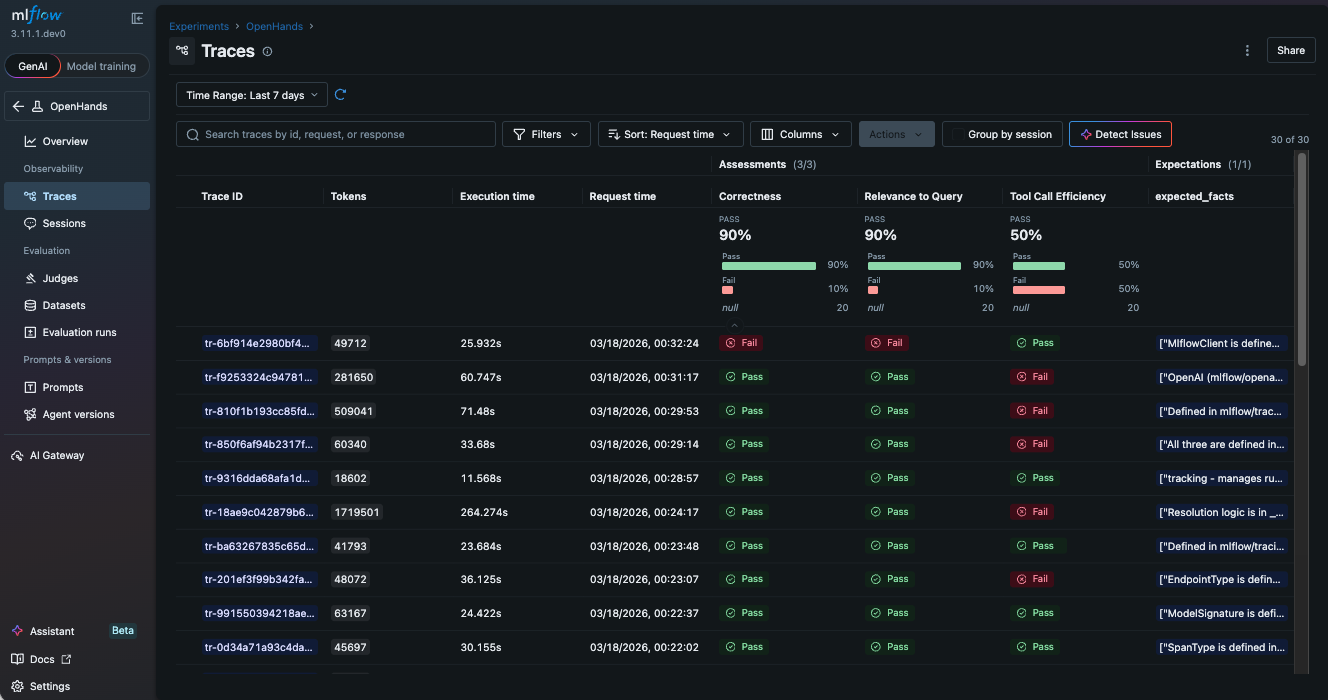
- MLflow shows the results once the judges are finished on the same page with new columns added to the table.
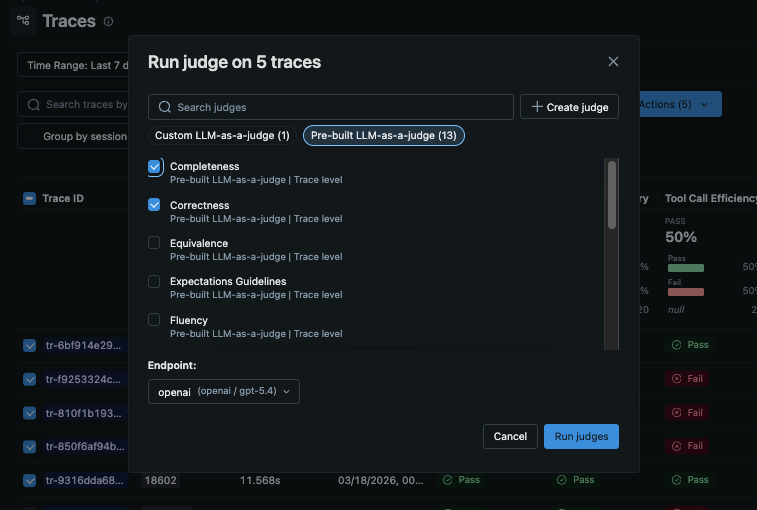
In the following example, we use three scorers to evaluate the output quality.
RelevanceToQuery: Whether the output is relevant to the original requestCorrectness: Whether the output is correctToolCallEfficiency: Whether the tool calls are efficient
See Built-In LLM Judges for the full list of built-in judges.
Each trace is assessed against the scoring criteria, producing clear pass/fail indicators and detailed rationale from the LLM judge. This is especially powerful for agents that run unattended. You define the quality bar, and MLflow tells you whether the agent cleared it.
Alternatively, you can run evaluation programmatically with the mlflow.genai.evaluate() API as shown below.
import mlflow
from mlflow.genai.scorers import RelevanceToQuery, Correctness, ToolCallEfficiency

# Load OpenHands traces from MLflow
traces = mlflow.search_traces(locations=["123"], max_results=10) # substitute "123" with your experiment ID

# Evaluate output quality
results = mlflow.genai.evaluate(
    data=traces,
    scorers=[
        RelevanceToQuery(),
        Correctness(),
        ToolCallEfficiency(),
    ],
)
The link to the evaluation results will be displayed in the console.
Governance for LLM Traffic with AI Gateway
One pitfall in highly autonomous agents like OpenHands is that they come with their own set of risks. They might burn excessive tokens for long-running tasks, leak sensitive data to LLM providers, or get compromised by prompt injection attacks.
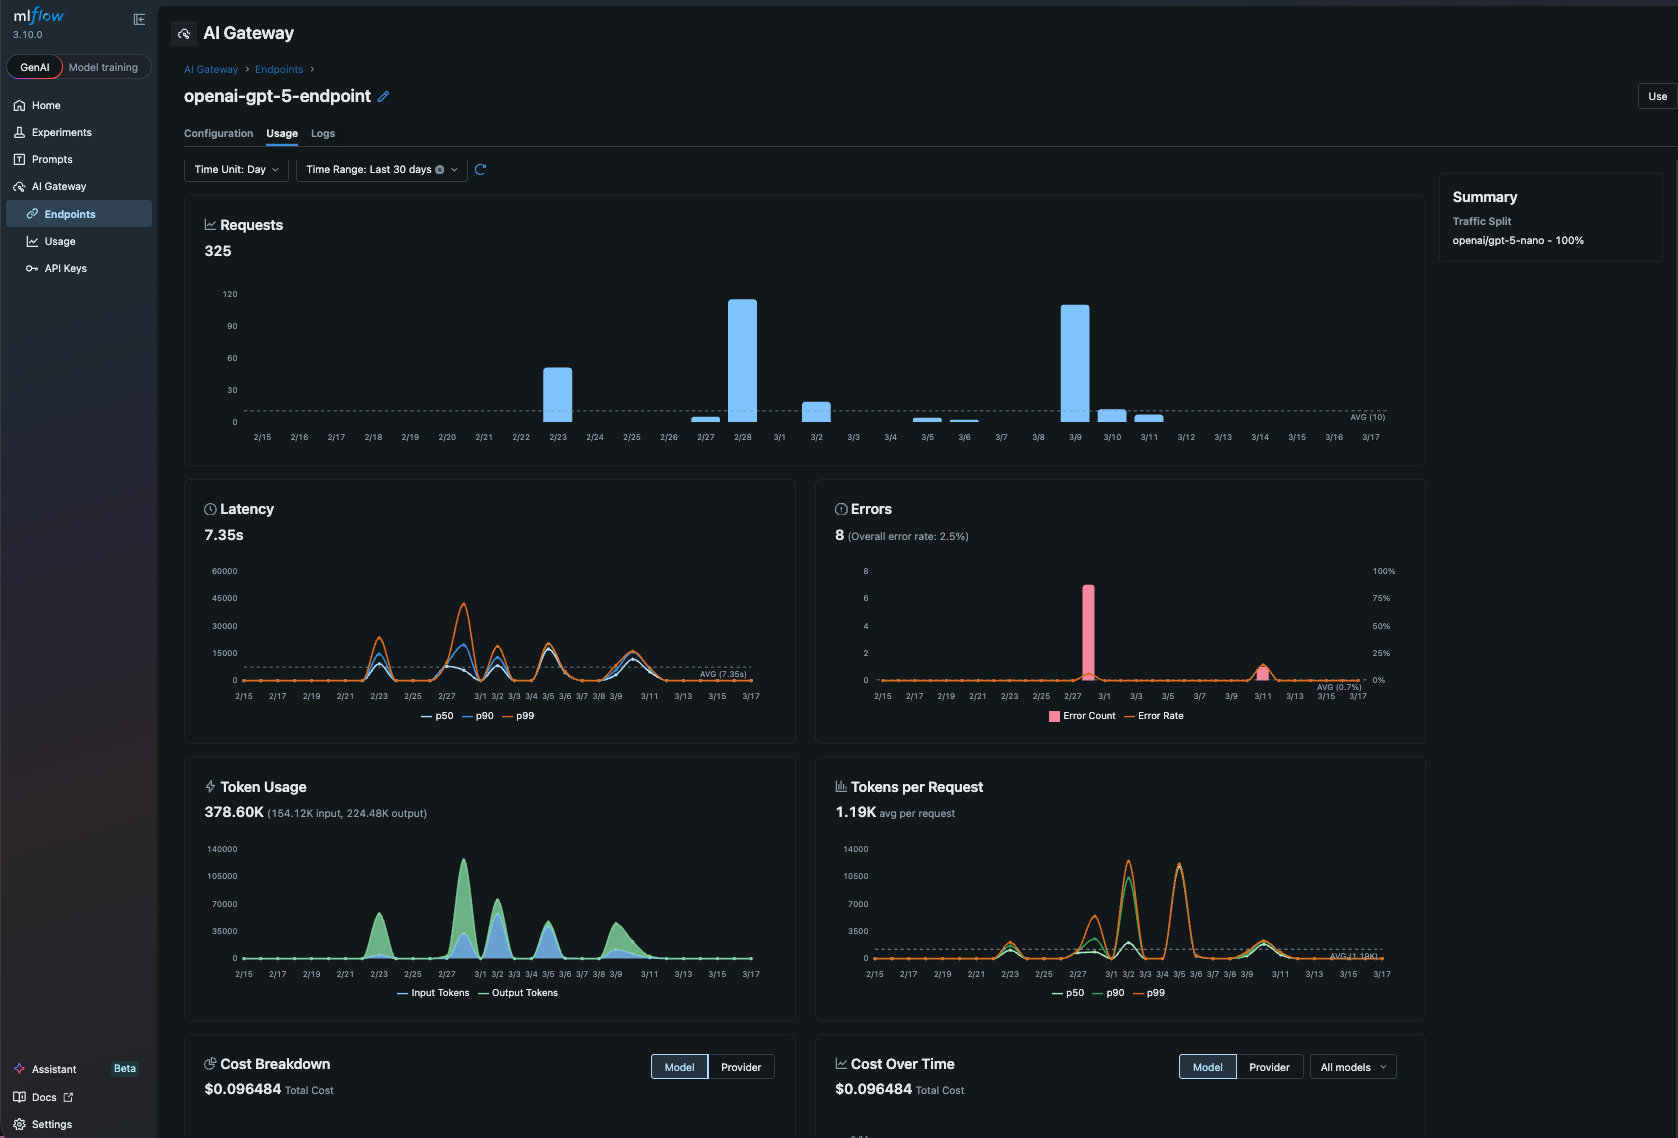
AI Gateway is a centralized proxy layer that sits between your application and LLM providers. It routes requests through a single, unified API while managing credentials, tracking usage, enforcing governance policies, and providing complete observability across all LLM calls. Instead of scattering API keys across scripts and environments, you configure credentials once in the gateway and let it handle authentication, cost tracking, and policy enforcement for every request.
Using MLflow AI Gateway with OpenHands is extremely easy. Just set the base_url to the AI Gateway endpoint URL (you can find it in the MLflow AI Gateway UI -> Endpoints -> Use).
llm = LLM(
    base_url="http://localhost:5000/gateway/mlflow/v1", # MLflow AI Gateway endpoint URL
    model="my-openai-endpoint", # Set the model to the name of the endpoint you want to use
)
That's it! Now all LLM traffic from OpenHands is routed through MLflow AI Gateway. It gives you governance and observability for free, for example,
- Budget control - set a budget policy to alert or reject when the spending exceeds a threshold
- Usage tracking - every LLM call is logged automatically with token-level cost visibility
- Secret management - store API keys securely in the centralized gateway and never expose them to your scripts
- Fallback routing - define fallback chains to route requests to a backup provider if the primary one is unavailable
Summary
OpenHands agents are powerful but autonomous, which means you need robust observability to trust and improve them. MLflow provides that in three layers as an AI Platform:
- Trace every agent run with three environment variables. See tool calls, LLM interactions, and token counts as structured, searchable spans.
- Evaluate output quality and tool effectiveness with built-in and custom scorers. Catch regressions before they reach production.
- Govern LLM traffic through AI Gateway for cost control, usage tracking, and centralized credentials management.
Both projects are fully open source, and we expect deeper integrations as the ecosystem matures.
If you find this useful, give us a star on GitHub: github.com/mlflow/mlflow⭐️
Have questions or feedback? Open an issue or join the Slack channel.