From Black Box to Observable: Tracing OpenClaw with MLflow

OpenClaw is an open-source personal AI agent that runs on your own machine. You talk to it through WhatsApp, Telegram, Discord, Slack, or any of 20+ messaging channels, and it acts on your behalf: triaging emails, managing tasks across Notion and Things 3, searching the web, reading and writing local files, and orchestrating whatever custom skills you've built. With 68,000+ GitHub stars and over 5,400 community-built skills on ClawHub, it has quickly become one of the most popular ways to run a local-first AI assistant.
The challenge is that OpenClaw's power comes from autonomy. It decides which tools to call, in what order, and whether to spawn sub-agents for sub-tasks. That makes it capable, but also opaque. When the agent handles a request well, you don't know why. When it handles one poorly, you don't know where it went wrong. You just see the final message in your chat.
This post shows how to add MLflow Tracing to OpenClaw so that every agent run becomes a fully inspectable execution timeline. We'll walk through setup, explain what traces capture, and use a concrete example to show how tracing turns vague suspicions into actionable debugging information.
Why Tracing Matters for a Personal Agent
You might think tracing is only for production systems with SLAs and uptime requirements. But personal agents have their own version of the same problem: you're relying on the agent to do real work for you, and when it gets something wrong, you need to understand what happened so you can fix it.
Consider a few scenarios that are hard to debug without traces. You ask your OpenClaw agent to summarize this week's AI news and draft a brief. The summary is shallow and misses the biggest story. Was the web search tool returning poor results? Did the model ignore relevant results during summarization? Did it hit the context window limit and silently drop content? You ask it to reschedule a meeting based on your calendar, and it picks the wrong time slot. Did the calendar tool return stale data? Did the model misinterpret the constraint you gave it? You won't know from the chat reply alone.
Tracing captures the full execution path of every agent run: each LLM call with its prompt and response, each tool invocation with its parameters and result, each sub-agent spawn and its own nested steps, along with token counts and timing for everything. That record transforms debugging from guesswork into direct inspection. You open the trace, find the step where things diverged from what you expected, and now you know exactly what to fix, whether that's a skill definition, a tool configuration, or the way you phrased the request.
Beyond debugging individual runs, traces become the foundation for systematically improving your agent. When you can see how the agent handled a task, you can give it targeted feedback, refine the skills it uses, and verify that your changes actually worked. Tracing is what makes that feedback loop possible.
Your Data Stays Local
One reason MLflow is a natural fit here is that it shares the same local-first philosophy as OpenClaw. MLflow is 100% open source, governed by the Linux Foundation, and fully self-hosted. When you run an MLflow server on your machine, all the trace data from your OpenClaw agent stays on your infrastructure and never leaves it. No telemetry gets sent to a third party, no vendor has access to your prompts or tool outputs. For a personal agent that handles your emails, calendar, and files, that matters.
Setting Up MLflow Tracing with OpenClaw
Getting started takes just three steps. First, install the OpenClaw MLflow plugin:
openclaw plugins install @mlflow/mlflow-openclaw
Then start an MLflow server locally to ingest the traces.
uvx mlflow server --port 5000
MLflow supports different deployment options like Docker, Kubernetes, and managed services like Databricks and AWS SageMaker. See Set Up MLflow Server for more details.
Then configure the MLflow connection using the built-in setup wizard:
openclaw mlflow configure
The wizard walks you through setting your tracking URI and experiment ID interactively. If you prefer to set these manually, you can use environment variables instead:
export MLFLOW_TRACKING_URI=http://localhost:5000
export MLFLOW_EXPERIMENT_ID=<your-experiment-id>
That's it. Start OpenClaw as usual and use it normally. Once the integration is enabled, tracing is automatic. Every agent run generates a trace that gets recorded in your MLflow server. There is no need to modify your skills, tool definitions, or agent configuration.
Open http://localhost:5000 in your browser and you'll see traces appear as your OpenClaw agent runs.
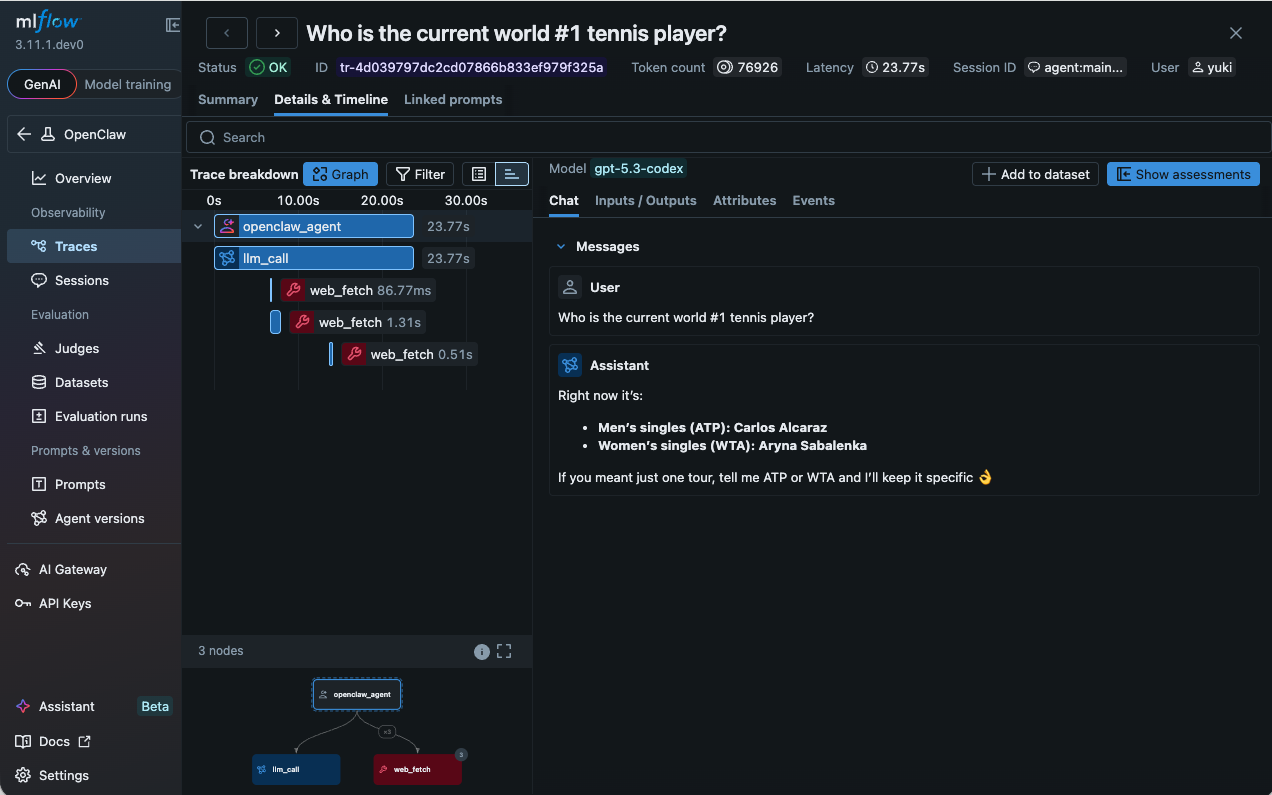
What a Trace Looks Like
Each OpenClaw agent run produces a hierarchical span tree. At the top is the root agent span, representing the entire run from the moment your message arrives to the moment the agent sends its reply. Nested inside it are the individual steps the agent took, organized by type.
LLM spans capture each model call, including the full prompt sent to the model, the response received, and token counts (input, output, total). Because OpenClaw uses a ReAct loop where the model reasons, acts, observes, and reasons again, a single user request can generate multiple LLM turns. Each turn appears as its own span, so you can follow the agent's chain of reasoning step by step.
Tool spans record every tool invocation. You can see the tool name, the parameters the model chose to pass, and the return value or error. When a tool call fails, the error message is captured directly in the span, making it immediately visible. This is especially useful for OpenClaw's rich tool ecosystem, where a single request might touch web search, file I/O, calendar APIs, and messaging channels.
Sub-agent spans appear when OpenClaw spawns child agents to handle sub-tasks. Each sub-agent gets its own branch in the span tree, with its own LLM and tool spans nested inside. This makes it possible to understand the full execution even when agents are delegating to other agents.
Every span carries metadata including timestamps, duration, and usage statistics. The result is a complete, inspectable timeline of everything the agent did.
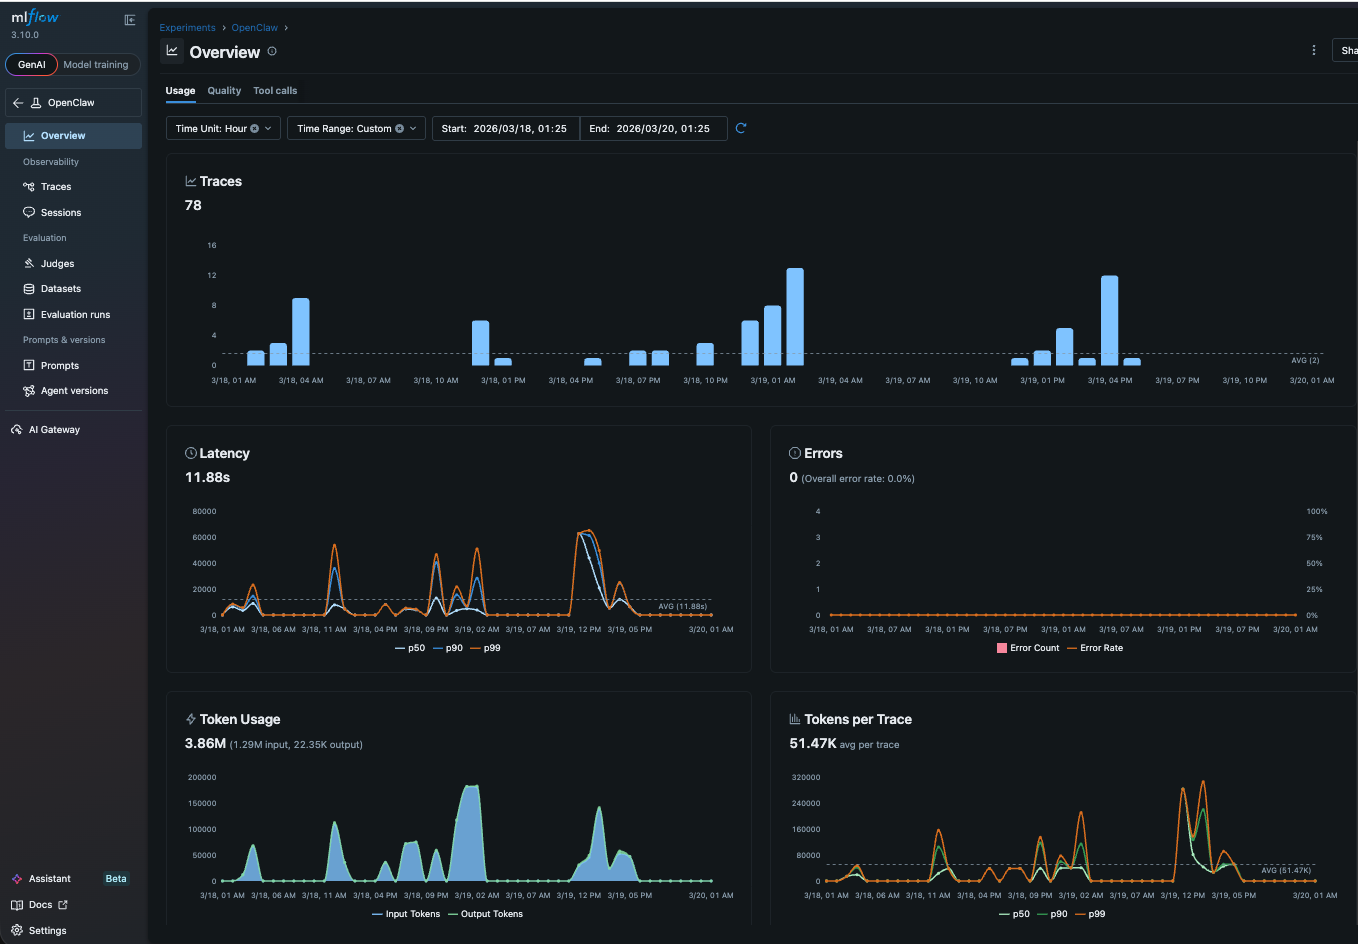
Monitoring Trends with the Dashboard
Once traces start flowing into MLflow, the operational dashboard gives you a bird's-eye view of how your agent is performing. You can see error rates across runs, which tools are being called most frequently, and how token consumption trends over time. If your agent starts failing more often after you update a skill, or if token usage spikes because a new tool is triggering longer reasoning chains, the dashboard surfaces it before you notice it in chat. Think of it as the health check for your personal agent: a single page that tells you whether things are running smoothly or whether something needs attention.
From Observations to Improvements
Traces are useful for debugging, but their real value is closing the feedback loop between you and your agent.
When you review a trace and notice the agent did something well or poorly, you can record that feedback in MLflow as a structured annotation on the trace or session (a group of traces sharing a conversation ID). A thumbs-down on a trace that used the wrong tool, a note on a session where the agent missed context from an earlier message. Over time, this builds up a labeled dataset of what your agent gets right and what it gets wrong. That dataset becomes the basis for everything that follows: evaluating new skill versions, tuning prompts, and understanding which types of requests your agent handles reliably.
Here is where things get interesting. You can give OpenClaw direct access to its own traces and feedback through the MLflow CLI and Skills. The agent can read traces of its past runs, see which ones received negative feedback, and use that information to refine its own skill definitions. You provide the signal (feedback on traces), and the agent does the work of translating that signal into better behavior. This is the self-improving loop that tracing makes possible: observe, annotate, and let the agent learn from its own history.
What Comes Next
Tracing is the foundation, not the ceiling. Once you have visibility and a feedback habit, the natural next step is evaluation. Define scorers for the quality dimensions you care about most and run them against your collected traces. The judges will surface patterns you might not have noticed manually: maybe your agent is consistently verbose, or consistently fails to cite sources, or handles one category of requests much better than another. MLflow also supports continuous evaluation, which scores every new trace automatically as it arrives, so you don't need to run eval manually at all.
The progression is deliberate: start with visibility, add human feedback, then automate quality measurement. Each step builds on the one before it, and you can stop at whichever level meets your needs.
If this is useful, give us a star on GitHub: github.com/mlflow/mlflow⭐️
Have questions or feedback? Open an issue or join the conversation in the MLflow community.